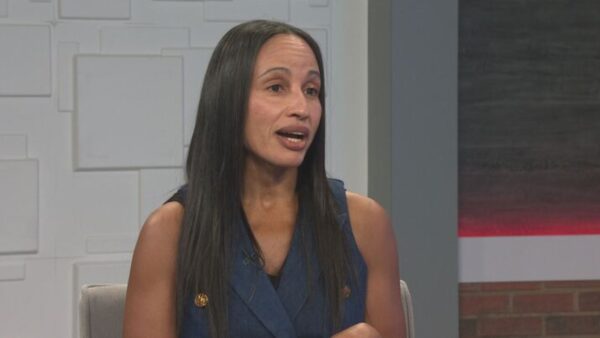
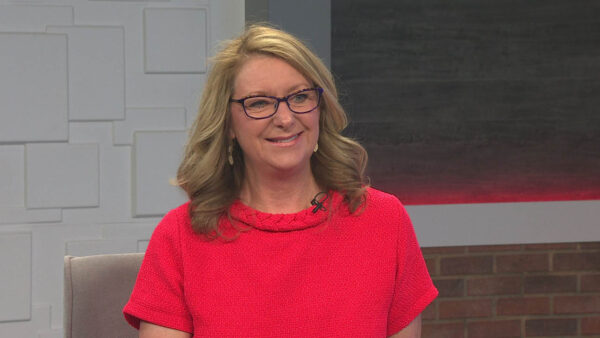
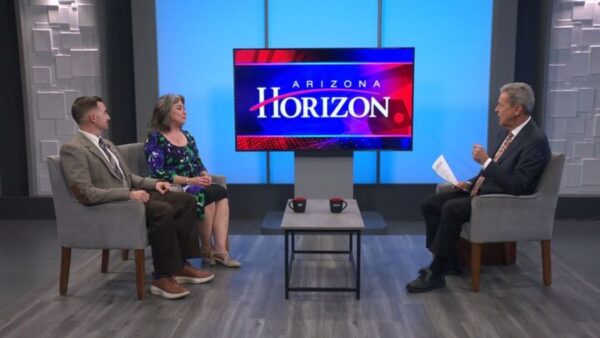
According to a new audit, the percentage of education spending that makes it into Arizona classrooms is the lowest it’s been in ten years of tracking that data. Tara Lennon of the Arizona Auditor General’s office discusses the findings.
Ted Simons: A report released today shows that the percentage of spending that reaches Arizona classrooms is the lowest it's been in 10 years of state monitoring. The report says that the declining percentage of spending for instructional costs likely indicates that school districts are illegally diverting sales tax money designated for the classroom. Here to explain is Tara Lennon with the Arizona office of the auditor general. Good to see you here, thanks for joining us. Give us a general overview now of what this report was looking at and what the report found.
Tara Lennon: Annually we produce this report that shows statewide spending trends, and individual district spending, and it provides a little snapshot for every district in the state, what are districts spending on instruction, on administration, or other nonclassroom operations such as food service or transportation? And it helps them see how do they compare, how do districts compare with other peer districts, are they running efficiently or not efficiently, and also provides some student achievement information for each district. So the report has two parts to it. A statewide trend, summaries of spending overall, and then it provides a snapshot of every district in the state. And this complements our performance audits that we do of individual districts. So we take insights that we glean throughout the year of going into an individual district, offering recommendations on how to improve their operations, and then we summarize them in this annual report now, we have found as we've reported in prior years Arizona spends less overall than districts do nationally. And we also spend lower percentages on instruction and administration. But what's really interesting is that within Arizona, districts vary significantly in their cost and spending practices. And even among districts of similar type with similar operational challenges --
Ted Simons: Give us an example of that, can you?
Tara Lennon: Yeah, for example I can think of one rural unified small size districts that spends about $900 per pupil on administration, and another district with the exact same characteristics that spends $2400 per pupil. These kinds of wide ranges of costs, we're seeing this across all kinds of spending areas, all the main ones, plan operation, transportation, food, service, and our performance audits find a similar variety of inefficiency and efficiencies at districts.
Ted Simons: Talk to us about -- let's go both sides, efficiencies, inefficiencies. What are you finding?
Tara Lennon: It depends on which spending area you're talking about. So if you -- go to our report and look at the layout for administrative costs and administration, the efficient districts, these are ones that are monitoring their staffing levels, and they might be wearing multiple hats if they're a small district because size really matters when it comes to administrative costs. So we find districts that are able to play multiple roles if they're small or if they're large, they're really monitoring their benefit packages, they aren't offering, for example, some of the inefficient districts they're offering pretty costly benefit packages where they're getting 15 years of health benefits after retirement, or they might have excessive conference travel. So we'll find that in administration those are just some of the examples. And these are all from performance audits. And plant operations, this is the other major noninstructional spending categories, it's not just administration, sometimes people think you're in the classroom or administration, but for plant operations this, is maintaining facilities. This is a major cost for a lot of districts, and if you're a small district and you have to spend a lot on energy, this will -- some of the more efficient districts figure out very effective conservation plans. Some of the inefficient districts, and this is one of the biggest challenges in Arizona, are operating too much space, excessive space, they might have four schools operating when all those students could possibly if it in one school. So when you're operating, maintaining that kind of excessive square footage, you're going to run into high costs.
Ted Simons: Let's get to definitions real quickly. The report said just under 56% on teacher pay and other instructional cost, down from a peak of 59%. When we talk about classroom spending, what are we talking about?
Tara Lennon: Teacher salaries, it's mostly all teacher salaries or salaries for instructional aides. To some extent it includes -- it does include instructional supplies, but the vast majority is teacher salaries.
Ted Simons: Things like coaches, things like activities, choir, these sorts of things, is that considered classroom spending?
Tara Lennon: Yes. Athletic coaches are considered, instructional spending as well.
Ted Simons: Compare if you can, and work -- help us figure it out now, classroom spending, administrative costs, what is the graph showing as far as spending for both?
Tara Lennon: Well, we've been historically the lower in both compared to national averages. We're looking at 56% of every dollar spent on instruction, and in administration, it's about 9.5%. Now that noninstruction half, if you take that 56% that whole other half of the pie, only that 10% is spent roughly on administration, then have you another 12% on plant operations, that's heating and cooling, maintaining buildings, then the other parts of that noninstruction half include providing transportation to the students, food service, student support costs, such councilors and social workers. So that's the other half.
Ted Simons: OK. Help me here, because I know we have prop 301, a sales tax, we've got the state land sales, all designed to help per pupil spending, all designed to help with an overall increased funding in the class. What happened there? It seems like the economy is playing a big factor here. How much is that factoring into the report?
Tara Lennon: This report looks at fiscal 10 funding -- spending and that ended in June 2010. They're facing additional budget cuts in this fiscal year '11 and fiscal year '12 and '13. This focus on actual spending. What did they actually spend, and that's that 56%. Back in 2000 is when voters passed proposition 301, added sales tax dollars to primarily supplement teacher salaries, supplement instructional spending. Well, what we expected to see is that they would maintain their level of effort much other monies, add to it these classroom site fund monies so we could see a higher percentage spent in the classroom. What happened is the technical term called supplanting. Districts overall shifted how they spent their other monies and used the classroom site fund monies as backfill, if you would, to maintain almost status quo. There were some increases, but not nearly what we expected. We would have expected with the classroom sites, something close to 59%. And we find ourselves at 56.
Ted Simons: Does the illegal diversion -- the idea there?
Tara Lennon: It's a violation of state law. There's a supplanting clause, when voters put in the sales tax, that they would only be using the monies to supplement, not supplant. Now, in fiscal year '10 this is the first year in the decade that we're seeing a drop in overall spending. Up to that point between 2001 and 2009 we saw about a 47% increase. But between '09 and '10, districts saw a 4% decrease in overall spending. Half of that decrease was pretty much from that sales tax revenue drying up. So districts are feeling that cut, but that cut in sales tax dollars, that explains maybe a half percent of the drop that we saw in the classroom dollar percentage between '09 '10. It doesn't explain all of it, and it doesn't explain why the classroom dollar percentage has been dropping since 2004.
Ted Simons: We've got about 15 seconds left. What do you want folks to take from this report?
Tara Lennon: To use their district pages to evaluate their own district, so every district has shown for -- whether it's operationally efficient or not, what areas it needs to improve its operations on, how it chose to spend district money, and a little bit on student achievement. So if taxpayers and parents and educators were able to use this report to make changes with how the district manages their money, then that would be great.
Ted Simons: Very good. Tara thanks for joining us. We appreciate it.
Tara Lennon: It's been my pleasure.
Tara Lennon:Arizona Auditor General's office;
