The Gold King Mine spill dumped three million gallons of contaminated water down the Animus River in Colorado, water that eventually found its way down to Arizona. The Arizona Geological Survey has launched an interactive map where the results of over one-hundred water samples can be tracked. Arizona Geological Survey research geologist Brian Gootee will tell us more.
TED SIMONS: Coming up next on "Arizona Horizon," well check out an interactive map that shows the impact of last month's Gold King Mine spill. Also tonight, how local researchers are involved in a mission to find water on the moon. And there's a new report out today on childhood hunger in America's suburbs. Those stories next on "Arizona Horizon."
VIDEO: "Arizona Horizon" is made possible by contributions from the Friends of Eight, members of your Arizona PBS station. Thank you.
TED SIMONS: Good evening and welcome to "Arizona Horizon." I'm Ted Simons. The department of public safety is now reporting 11 shooting incidents along I-10. The latest occurred this morning near 83rd avenue and involved a shattered windshield and possibly a B.B. gun. Information leading to an arrest or indictment in the case is at $20,000. And a federal judge heard arguments today in a lawsuit filed by the Tonono O'odham Tribe involving a casino near Glendale. The tribe is asking for an injunction that requires Arizona officials to stop trying to block the casino by not allowing a full casino license. Lawyers for the tribe says the casino will open in December with bingo-style machines but they can't have other forms of gaming without that license. The Arizona Geological Survey has launched an interactive map that tracks water samples from the Gold King mine spill, which dumped 3 million gallons of contaminated water down the Animus River in Colorado, water that eventually found its way to Arizona. Here with more on the tracking map is the Arizona geological survey's Brian Gootee. Good to have you here. Thanks for joining us. Let's get an overview, first of all, The Gold King mine spill. What exactly happened?
BRIAN GOOTEE: About five weeks ago there was a large spill at the Gold King mine north of Durango, Colorado. Contractors with the EPA were trying to work at the site and accidentally released about 3 million gallons of contaminants. These contaminants went into cement creek which eventually flowed into the animus river.
TED SIMONS: As far as Arizona water, how much was threatened?
BRIAN GOOTEE: The evidence shows that none of the water that reached the lake Powell area showed any signs of contaminants.
TED SIMONS: Is that a done deal or could we still see some in the future?
BRIAN GOOTEE: It's possible that some of the contaminants that are trapped in the sediment in the an Juan and animus rivers could be released during a flood event but that's one of the things that you continually monitor there.
TED SIMONS: As far as monitoring water analysis, when was the water analysis? We're going to look at the map here in a second. When were these analyses taken?
BRIAN GOOTEE: The samples were collected from shortly after August 5th and I believe on the 5th or the 6th, all the way to the present, I believe the last samples collected were in late August.
TED SIMONS: So the information is still being updated?
BRIAN GOOTEE: Yes.
TED SIMONS: And as far as where they were taken, anything in particular? What are we seeing out here?
BRIAN GOOTEE: That's what the map will show us is the full extent and the scope of all of the data collection process but the samples have been collected from the mine's source of the contaminants all the way down to the animus and the San Juan and the Colorado river and into lake Powell and the latest extent it's being sampled for is near lee's ferry at the base of the dam.
TED SIMONS: Let's take a look at the map. What exactly are we looking at here?
BRIAN GOOTEE: Okay. So the map is a web service that we created to showcase data that is collected from eight agencies, federal, state and tribal agencies, so the purpose of this map was to utilize all of these multiple data sources into one-stop shop for data, and so the map shows -- a Google map base shows the extent of where all the samples were collected and on the left side we have a series of toggles, on-and-off switches, that showcase the parameters of the data.
TED SIMONS: So you have reporting agency over there, reporting authority I should say, sample type, you've got water and sediment, correct?
BRIAN GOOTEE: Yes, that is correct. So we can toggle on the top left you have all the reporting authorities that have committed to providing data from August 5th to the present. And into the future we'll continue to collect data and showcase these data sets. They range from federal EPA water quality data, the USGS will come online shortly and then state agencies from Utah, New Mexico, and Colorado and Arizona.
TED SIMONS: And I know that ADQ is up there somewhere. Can we see exactly -- there you go.
BRIAN GOOTEE: So we can turn off all of the other agencies here and this allows us to see the Arizona department of environmental quality have collect two samples, one -- it will tell you if you click on this upper sample, it tells you the sample number, the I.D., when it was collected, the coordinates, and then also, it was collected from the water intake at the dam. Is this a water sample or is it a sediment sample? And then a link to the Arizona department of environmental quality's website, and then a link to the actual data itself.
TED SIMONS: There you go.
BRIAN GOOTEE: So this allows you direct access to all the major basic data types.
TED SIMONS: Now, when it says arsenic, cadmium, lead and mercury not detected, does that mean other sites, they did find some of those contaminants but not here? Or does that mean that there's no information?
BRIAN GOOTEE: This is a great question because really there are more than four contaminants that came out of this mine spill and these four were EPA's selected for those top metals that were considered a high risk to health and safety. And so these four parameters were collected early on and they're continuing to be collected. So there are exceedances for each of these contaminants that go beyond the maximum contaminant level so the site allows you to zoom back out and reset. And then, for example, if you're interested well where was cadmium? Where did that show up in this map? You'll see that it showed up in Colorado only, where it exceeded the EPA's maximum contaminant level. These are just exceedances for those four metals.
TED SIMONS: As far as how you want folks to use this map? What's the goal? This is a lot of great information. I think fortunately not much of it is in Arizona thank goodness but there's still information there that's important. How do you want folks to use this?
BRIAN GOOTEE: Well, it's a multifunctional tool. It allows number one the federal and state agencies to actually work together and showcase all of their data in one place. Before this site was available, you had to go to six, seven or eight different agencies to find these data. And so if you're a stakeholder or user in this Colorado River system, you really have to look around all these different data sources to find that. So this allows number one the agencies to work together and number two to at least show and educate the public that they have this data available, they're working on it. These are the data and this allows them to actually see where the contaminants are showing up, when did they show up and who collected them?
TED SIMONS: And again, you can check that out and the information is being updated so if you want to find the latest information just go there I guess day to day or how often you see fit?
BRIAN GOOTEE: That's true, and it's always -- the great resource of this site is it allows you access the other entities in the data sources so you can check their website for the other data.
TED SIMONS: Well, it's very interesting stuff. Good to have you here. Thanks for joining us.
BRIAN GOOTEE: Thank you, Ted.
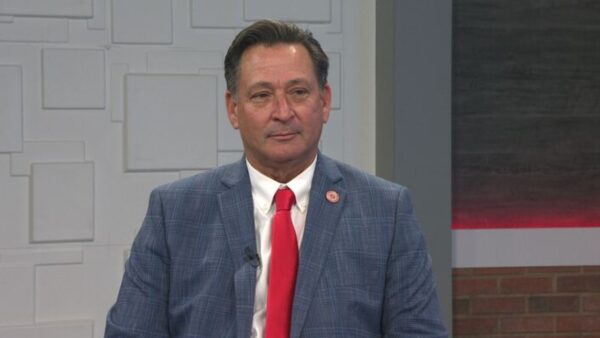
Brian Gootee: Arizona Geological Survey research geologist
